
TL;DR
- The cost of data silos is the spend, time and customer trust a business loses when customer data sits in systems that cannot share it.
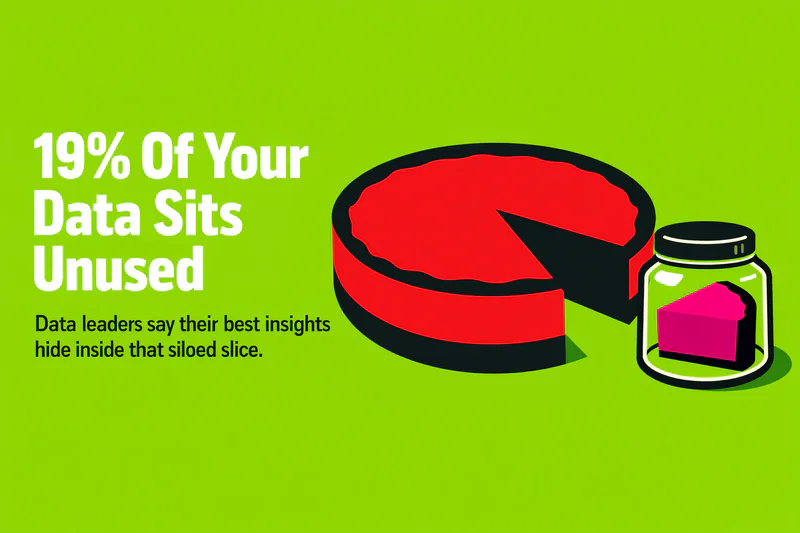
- In Salesforce's 2025 State of Data and Analytics survey of 3,800 data and IT leaders, respondents estimated that 19% of company data is siloed or unusable.
- For marketing, the bill arrives as three hidden costs: The Duplicate Budget, The Stale Segment and The Shelfware Stack.
- Silos slow marketing agility, the time from a customer signal to the right action, at every handoff between teams.
- Four ratios put a number on the damage in a week. One shared timeline of every conversation closes the gap.
A customer starts a personal loan application on Monday night and stalls at the income-proof upload. On Tuesday, the bank shows them an ad telling them to apply. On Wednesday, a sales rep calls to sell them a credit card.
Three teams. Three versions of one customer.
The cost of data silos is the money, time and customer trust a business loses when customer data sits in separate systems that cannot share it. In marketing, it shows up as paying twice for one customer, campaigns built on stale lists, idle tools and replies that arrive days late.
None of these losses has its own line in the budget. That is why they keep growing.
This guide puts names and numbers on the hidden costs, shows how silos slow marketing agility in BFSI, healthcare and automotive, and gives you four ratios to measure the damage in your own team.

What are data silos, and why are they problematic?
Data silos are stores of customer data held by one team or tool that other teams and tools cannot read. The ad platform knows the click, the CRM knows the deal stage, the service desk knows the complaint and the WhatsApp inbox knows what the customer actually said.
We built our silos one sensible purchase at a time, with a form tool for the landing page, an email platform for nurture, a dialer for sales and a helpdesk for service.
Each purchase solved a real problem. Together they split the customer into pieces.
The scale is larger than most teams assume. In the MuleSoft 2025 Connectivity Benchmark Report, a survey of 1,050 IT leaders run with Vanson Bourne and Deloitte Digital, the average enterprise ran 897 applications and only 29% of them were integrated.
Salesforce found the same pattern from the data side. In its 2025 State of Data and Analytics report, based on surveys of 3,800 data and IT leaders run between June and August 2025, leaders estimated that 19% of their company's data is siloed, inaccessible or otherwise unusable.
The same leaders went further. In that Salesforce survey, 70% of data and analytics leaders said their most valuable business insights sit inside that unusable 19%.
Silos are what a stack looks like when every tool was the right call on its own.
What is the cost of data silos for marketing teams?
The cost of data silos for marketing comes in three hidden forms, and none of them appears on an invoice under that name. Each one is a cost you are already paying.
The Duplicate Budget
The Duplicate Budget is the money spent acquiring a customer you already have. It happens when the ad audience, the CRM and the purchase record live in different places.
A car buyer takes delivery on Saturday. On Monday, the same buyer is still in a retargeting audience for the model they just bought, because the dealership's sales system never told the ad platform that the deal closed.
Every impression in that audience is paid for. Multiply it across every recent buyer, every approved applicant and every booked patient, and the duplicate spend becomes a visible slice of the media plan.
The Stale Segment
The Stale Segment is a campaign list built from data that was true last week. Most cross-team segments are still assembled from exports, so they start to age the moment they are pulled.
Salesforce's latest marketing research shows how little of the customer a marketer can see. In the 2026 State of Marketing report, a survey of 4,450 marketing decision makers run in October and November 2025, only 58% had complete access to service data, 56% to sales data and 51% to commerce data.
A marketer who cannot see the open complaint sends the upsell anyway. The customer who just complained reads it as proof that nobody is listening.
The Shelfware Stack
The Shelfware Stack is the software you pay for and cannot fully use, because the data each tool needs sits in another tool. In a 2023 Gartner survey of 405 marketing leaders, average martech stack utilization fell to 33%, and respondents named customer data challenges among the most common barriers.
A tool that cannot read the customer's history runs at a fraction of its capacity. You pay the full licence anyway.
Silos rarely fail loudly. They charge a small fee on every campaign, every week.
How do data silos slow down marketing agility?
Marketing agility is the speed at which a team turns a customer signal into the right action. A signal can be a half-finished form, a price question on WhatsApp, a cancelled appointment or a complaint to the service desk.
Silos stretch that speed at every handoff. Call it The Handoff Lag, the hours or days a signal waits in one system before the team that could act on it finds out.
Watch one test-drive enquiry reach two dealerships.
The Old Way. The buyer asks on WhatsApp whether the hybrid trim is in stock. The answer comes the next afternoon from a different rep, who also asks for the buyer's name, number and preferred model.
By then the buyer has booked a test drive at the dealership down the road. The CRM still shows a new lead.
The Connected Way. The reply arrives in under a minute, with stock for the hybrid trim and two test-drive slots. The rep who calls later sees the whole thread and starts from the slot the buyer picked.
See the difference? Both stores had the same data. One store let it move.
The gap shows up in survey data too. In Salesforce's 2026 State of Marketing research, marketing teams that had satisfactorily unified their data were 42% more likely to respond to customers regularly.
Speed lives in the data. A team cannot move faster than its slowest handoff.
Where do data silos hurt most in BFSI, healthcare and automotive?
Data silos hurt most where a customer journey crosses many teams and the customer decides fast. Three industries show the pattern clearly.
Banking, financial services and insurance
A loan or policy application moves through marketing, sales, underwriting, verification and service. When each step keeps its own record, the applicant who stalls at document upload gets a generic reminder, while the reason they stalled sits in a support ticket.
Guided completion needs one record of where the applicant stopped and why. With it, the next message picks up from that exact point.
Healthcare
A patient enquiry arrives by web form, the booking happens on the phone and the reminder goes out by SMS from a third tool. When a visit is cancelled, the marketing team rarely hears about it, so the rebooking offer never goes out.
To the patient, three systems look like one provider that forgot them.
Automotive
An automotive brand runs digital campaigns centrally while dealers run sales and service locally. Leads, test drives, bookings and service visits land in different systems, so the brand rarely knows which campaign sold a car and the dealer rarely knows which owner is due for service.
That split is The Duplicate Budget at national scale, paid once by the brand and again by every dealer.
The more teams a customer passes through, the more each silo costs.
How do you measure the cost of data silos?
You measure the cost of data silos with four ratios a marketing team can pull in a week. None of them needs a new tool, and each one maps to a hidden cost above.
| Metric | How to calculate it | Cost it reveals |
|---|---|---|
| Duplicate spend rate | Ad spend served to existing customers, approved applicants or booked patients, divided by total audience spend | The Duplicate Budget |
| Segment age | Average hours between a data export and the campaign send that used it | The Stale Segment |
| Signal-to-action time | Median time from a customer signal (form, message, cancellation) to the first relevant response | The Handoff Lag |
| Re-ask rate | Sampled conversations where the customer repeats details another team already holds, divided by all conversations sampled | Lost customer trust |
Start with a two-week sample if your systems cannot pull these on their own. A spreadsheet, an ad-audience export and an inbox export are enough for the first pass.
Then set the numbers next to the ones finance already tracks. A team whose cost per lead looks healthy while its signal-to-action time runs to a full day has found where its budget leaks.
A silo becomes a budget line the moment you measure it.
Why doesn't another integration project fix data silos?
Integration projects move records between systems, and they help. Most of them sync fields such as name, stage, owner and last activity, on a schedule.
The part that drives agility rarely travels. What the customer asked, what they were told and what they were promised lives in WhatsApp threads, call notes and email replies that no field captures.
Call it The Context Gap. Two systems can agree on a customer's stage and still have no idea why the customer stalled.
This is why the next connector rarely moves the four ratios above. Agility comes from a shared memory of the conversation, read by every team and every agent at the moment it acts.
Synced records tell you who the customer is. Shared context tells you what to do next.
How does Zigment keep customer context in one place?
Zigment is a Conversational Revenue Orchestration Platform for GTM teams, and it sits on top of HubSpot and Salesforce. Its AI agents answer, qualify, book, remind and follow up across WhatsApp, voice, SMS, email and web chat, inside rules the team sets once.
Under the agents sits the Conversation Graph, a timeline of every conversation each customer has had with you across every channel. When an applicant stalls, a patient cancels or a buyer asks about stock, the agent acts with that full history and writes the outcome back to the CRM.
Your existing tools stay where they are. What changes is that every team and every agent reads the same memory before it acts.
Count what your silos cost before you buy another tool
Your dashboards already report cost per lead, conversion rate and campaign return. They cannot report the ad served to last week's buyer, the upsell sent to an angry customer or the enquiry that waited a day for an answer.
Pull the four ratios for one month. Then ask the question your stack has never had to answer. How much of last quarter's budget went to customers you had already won, or already lost?
If you want to see what one shared customer timeline looks like, see how the Conversation Graph works.